The Florida State theory, tested on 1,560 college football openers
Everyone knows a good team that loses its opener as a favorite is broken. Nobody had ever checked, so we built the dataset and checked.
By Parker · August 30, 2026 · 9 min read
On August 24, 2024, Florida State walked into Dublin as a 10.5-point favorite over Georgia Tech. They had gone 13-0 the previous regular season. They lost by 3, and then they went 2-10.
Everybody drew the same conclusion, and everybody drew it immediately: when a good team loses a game it was supposed to win in its opener, something is broken, and you are watching the first evidence of it.
Call it the Florida State theory. It is the single most confident claim in college football's opening weekend, and as far as we can tell nobody has ever actually tested it. So we did.
The short version: the theory is right. A good team that loses its opener as a favorite really does underperform the rest of the way, by a meaningful and consistent amount, and the bigger the favorite the worse it gets. But almost everything else people take from opening weekend is noise, and the overall value of an opener is far smaller than the discourse implies.
Why you cannot answer this with Week 0
The obvious place to look is Week 0, the handful of games that kick off the season a week early. That is where the Florida State game was played. It is also where Nebraska lost to Northwestern in Dublin in 2022 and fired Scott Frost 15 days later.
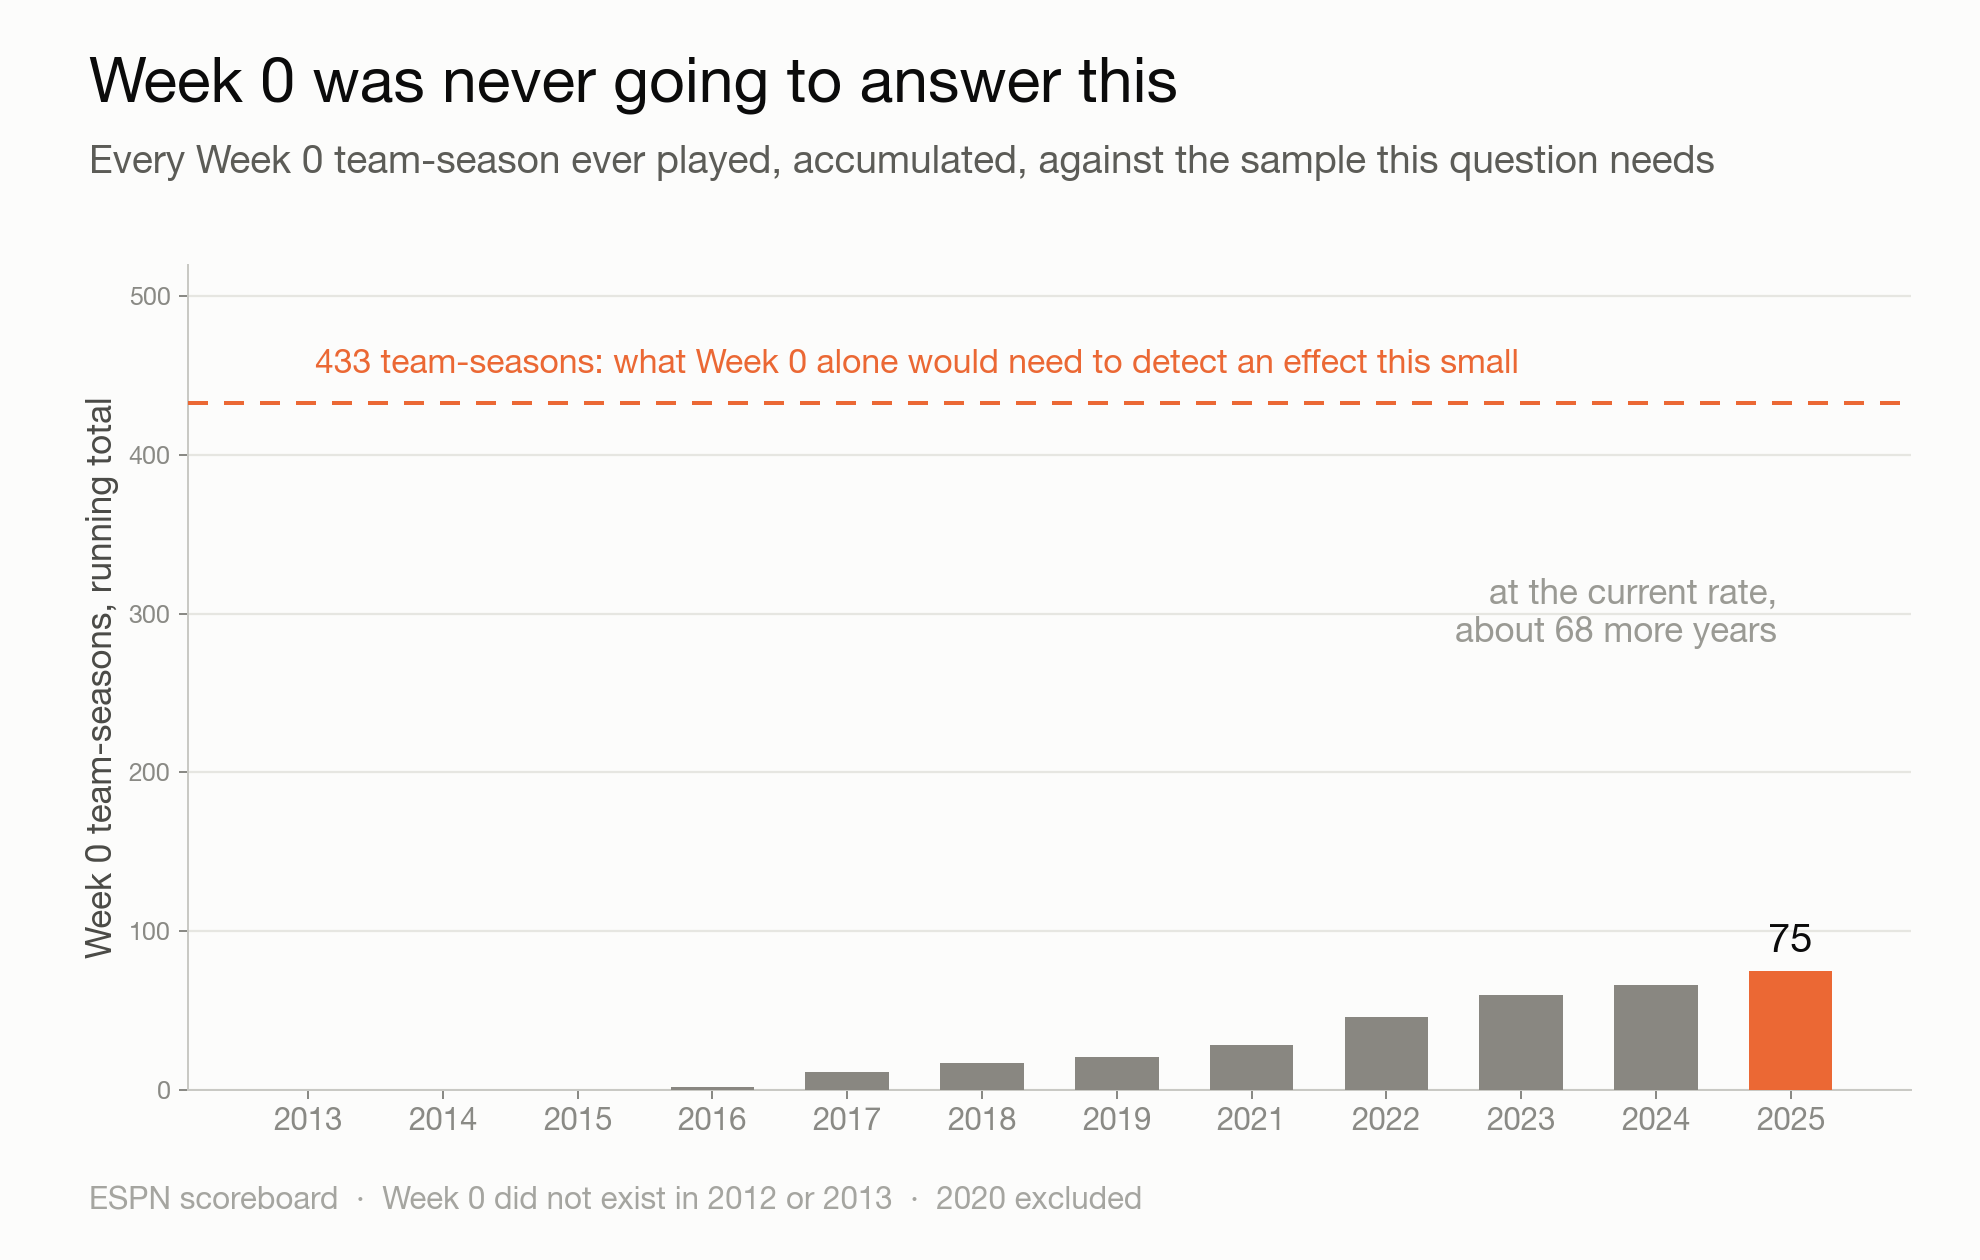
The problem is that Week 0 barely exists. It did not happen at all in 2012 or 2013. Since then it has produced 50 games and 77 FBS team-seasons, total. A single ordinary Saturday in October has more football in it than the last four Week 0s combined.
We ran the Week 0 numbers anyway, and they came back inconclusive on essentially everything. Only six teams in history have entered Week 0 favored by 3 or more and lost. Five had bad seasons. That is a striking anecdote and a useless sample: the confidence interval on the effect ran from -0.41 to +0.17.
Here is the important part. With 77 team-seasons, Week 0 can only detect effects larger than about 0.10 win%, which is roughly a win and a half over a season. Anything smaller is invisible to it. As you will see, the real effect is smaller than that. Week 0 was never going to find this, and it would need about 433 team-seasons to do so, which at the current rate is 68 more years.
So we widened the question. Not "what does Week 0 mean," but "what does any opener mean." Every FBS team's first game of the season, 2013 through 2025.
1,560 opener team-seasons. Twenty times the evidence.
First, the illusion
The number that fuels every opening-weekend take:
| Opener result | Rest-of-season win% |
|---|---|
| Won the opener (n=1,007) | .548 |
| Lost the opener (n=553) | .463 |
An 8.6 point gap. Looks decisive.
Now look at who those teams already were, the year before:
| Opener result | Prior season | Rest of season |
|---|---|---|
| Won the opener | .559 | .548 |
| Lost the opener | .466 | .463 |
| Gap | +.093 | +.086 |
The gap in what they did last year is slightly larger than the gap in what they do afterward. Good teams win openers. That is most of what you are looking at, and you could have predicted it in June.
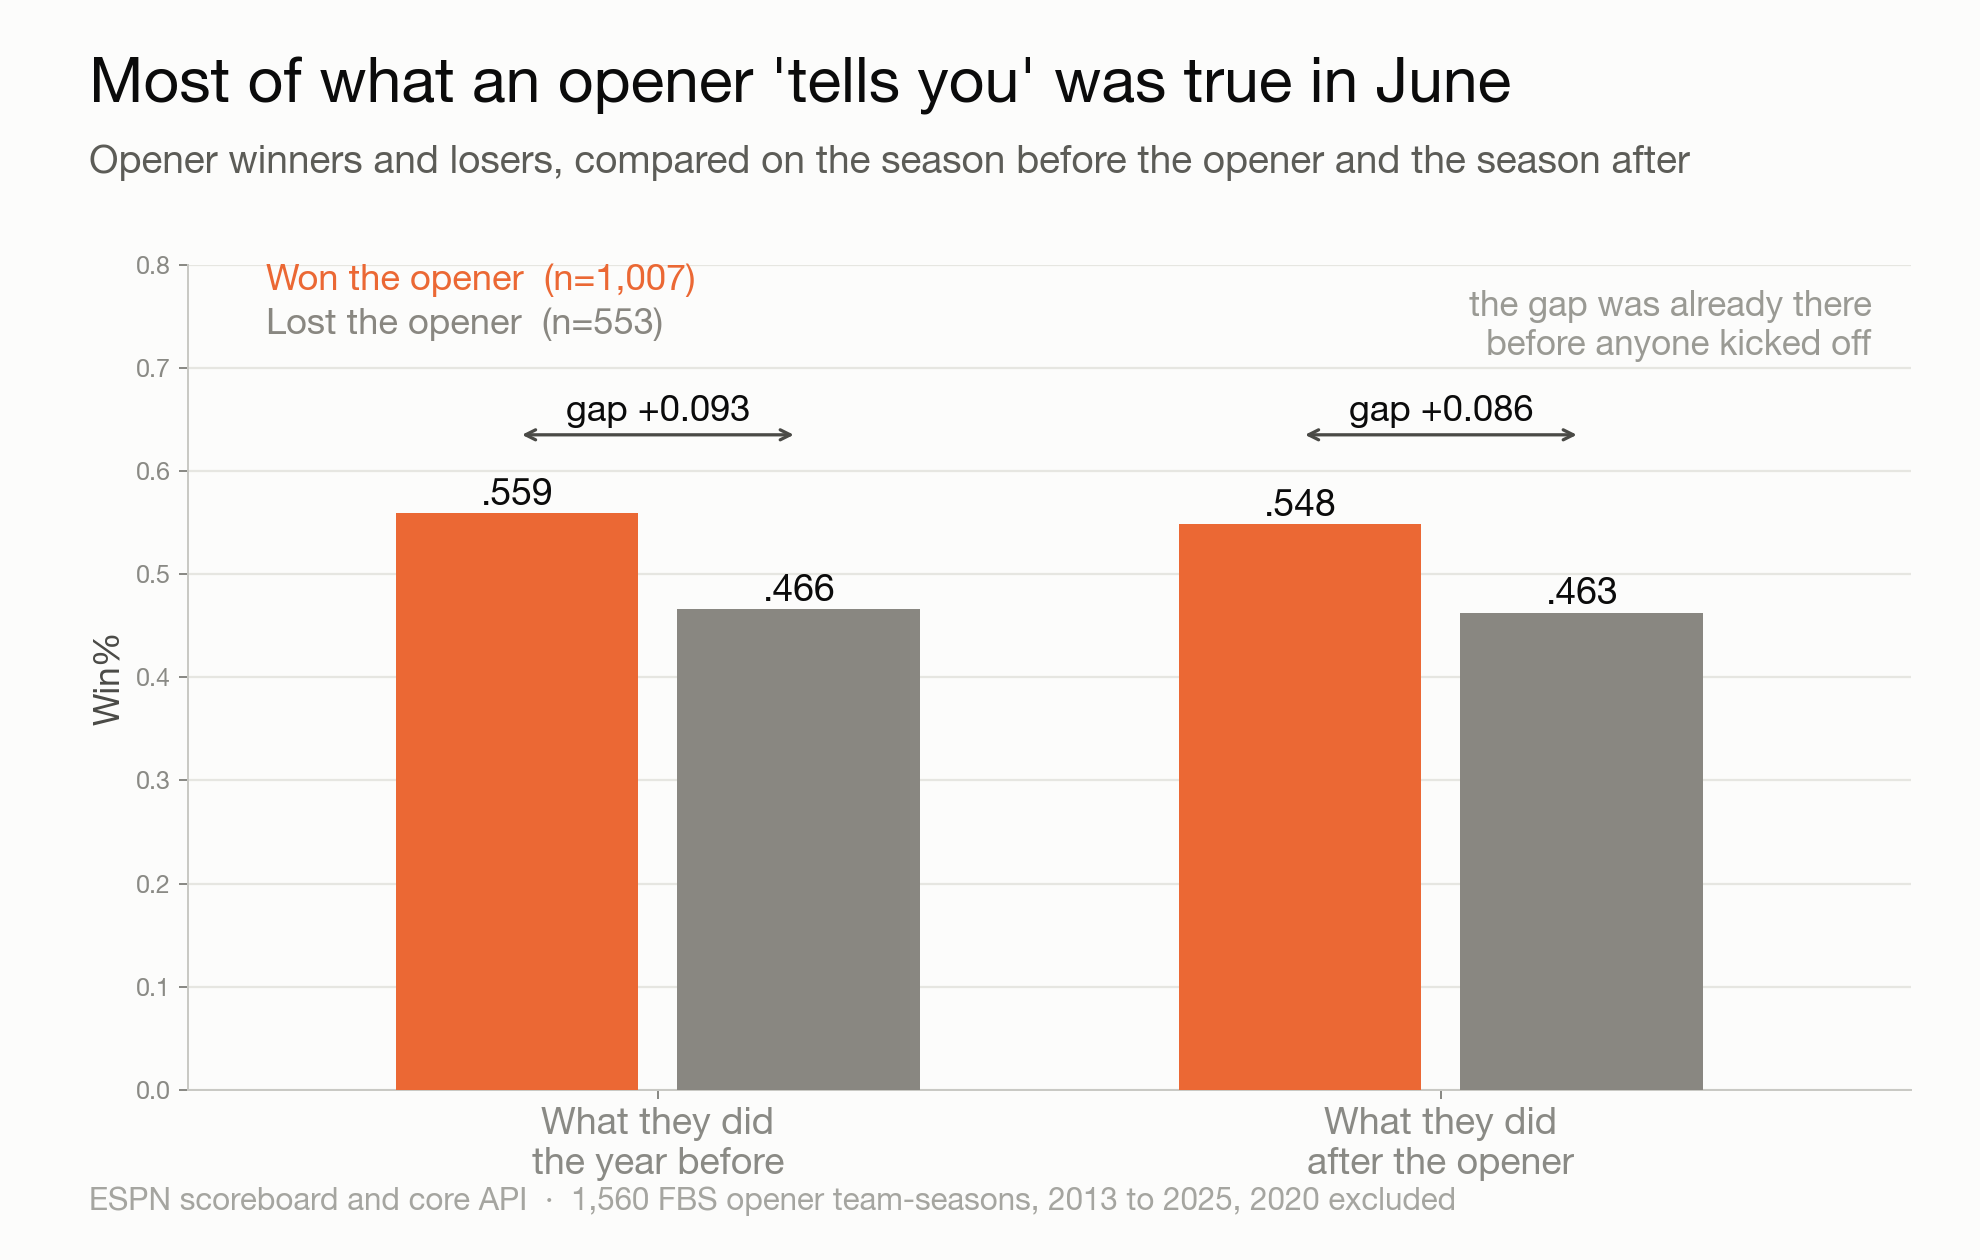
This is the trap almost every "openers matter" article falls into. So for everything below, we compare each team against what its prior season alone predicts, and report the residual: how much better or worse it did than that baseline.
An opener is worth about half a win
Controlling for prior-season quality, winning your opener is worth:
+0.040 rest-of-season win%, 95% CI [+0.018, +0.063]
That clears zero, and it holds up everywhere we cut it: 2013-2018 and 2019-2025 separately, home openers and road openers, teams coming off winning seasons and teams coming off losing ones.
Over an 11-game rest of season, +0.040 is about 0.44 wins.
So the answer to "do openers mean anything" is yes, and the answer to "how much" is less than half a win. Hold that number next to how opening weekend actually gets discussed.
It is all in the blowouts
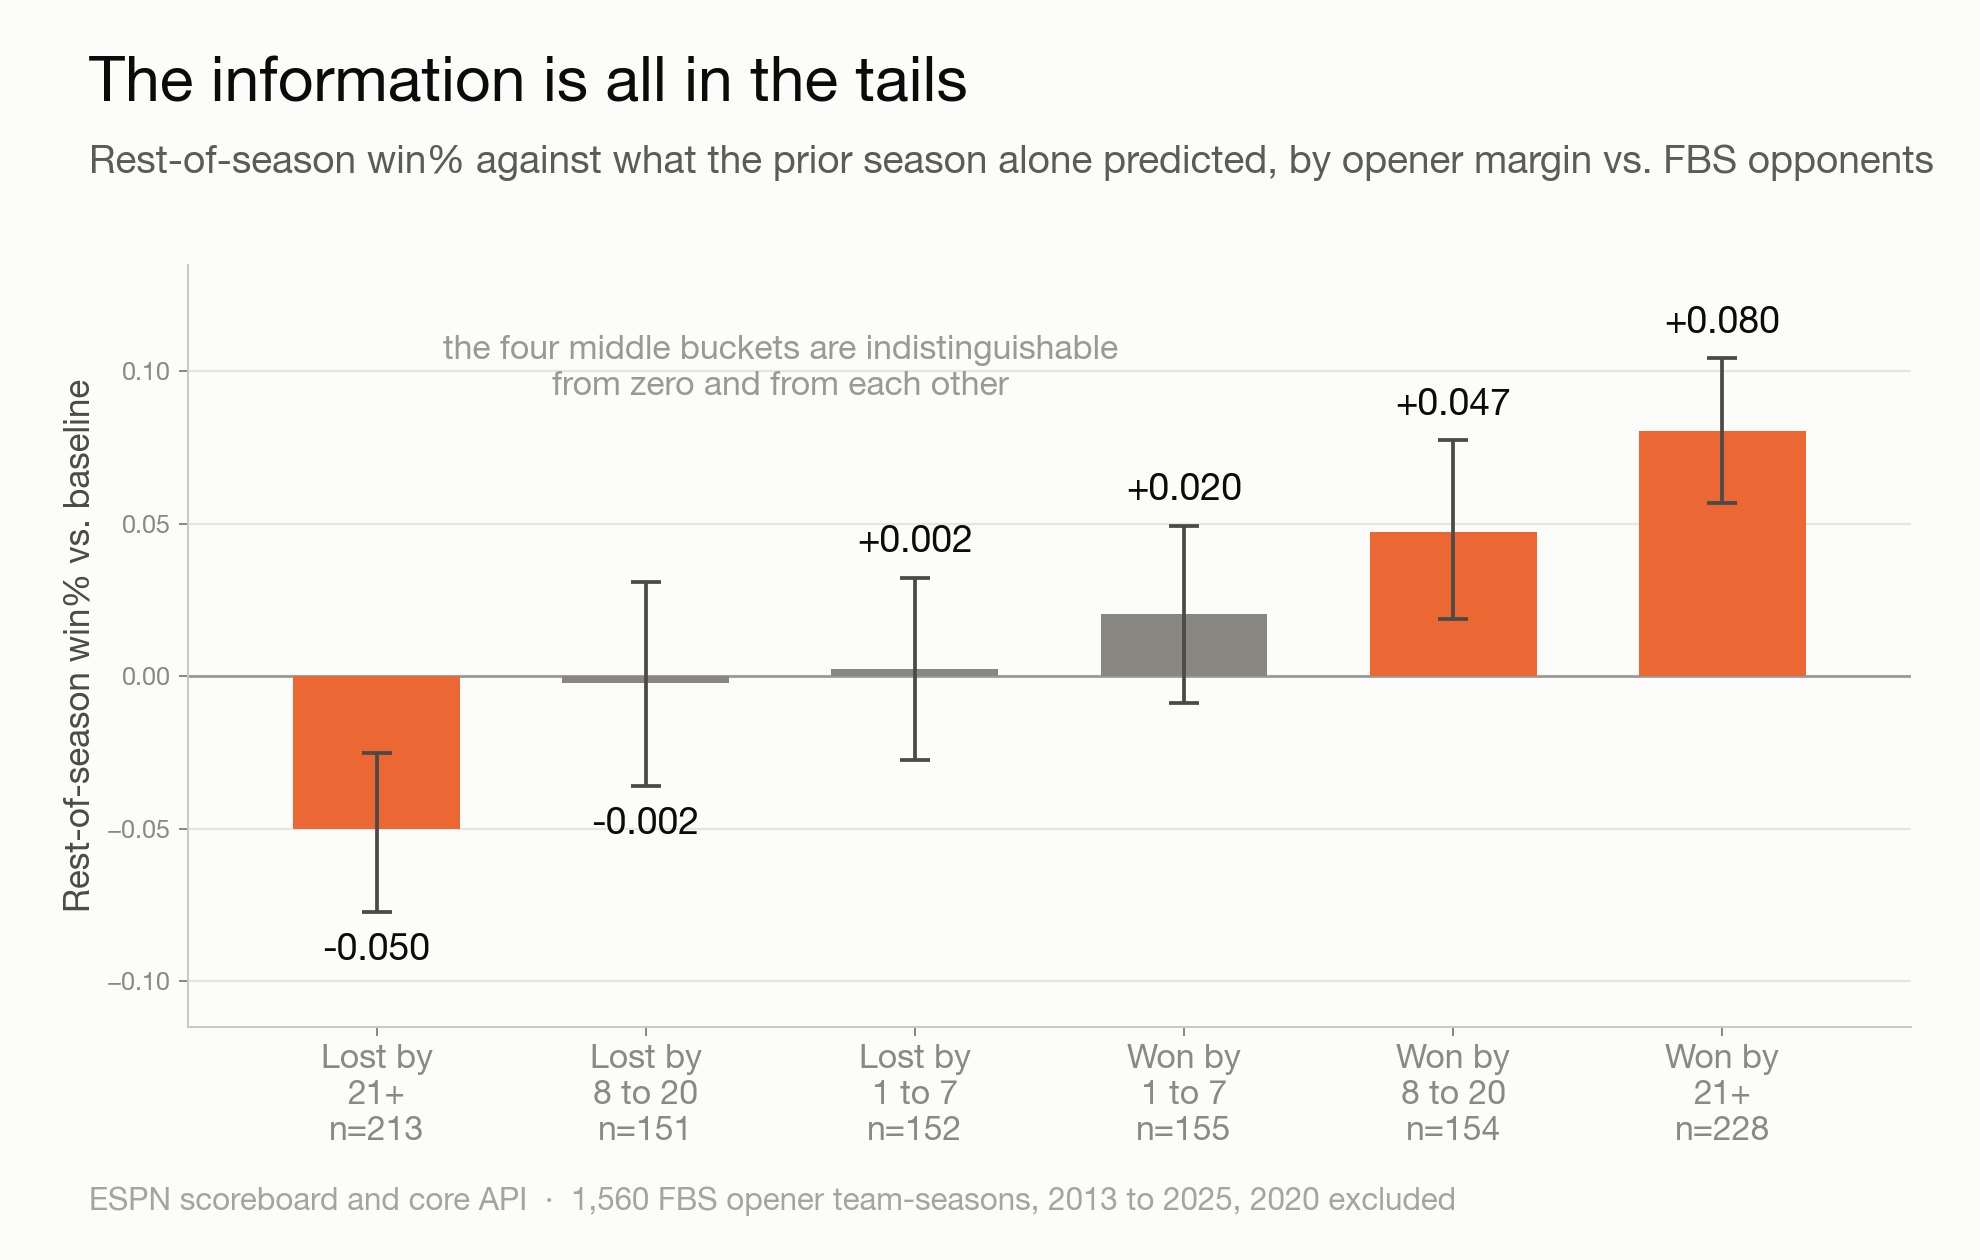
This is the finding we did not expect. Bucket teams by opener margin, against FBS opposition:
| Opener margin (vs FBS) | n | Residual |
|---|---|---|
| Lost by 21+ | 213 | -0.050 |
| Lost by 8-20 | 151 | -0.002 |
| Lost by 1-7 | 152 | +0.002 |
| Won by 1-7 | 155 | +0.020 |
| Won by 8-20 | 154 | +0.047 |
| Won by 21+ | 228 | +0.080 |
Bolded rows have confidence intervals that clear zero. The middle four do not.
A close opener tells you nothing at all. Losing by 3 and winning by 3 produce statistically identical seasons. All four middle buckets are indistinguishable from zero and from each other.
The information lives entirely in the tails. Getting blown out is real bad news. Delivering a blowout is real good news, and it is the single strongest positive signal in the dataset. Everything in between is a coin flip that people spend a week arguing about.
The Florida State theory, confirmed
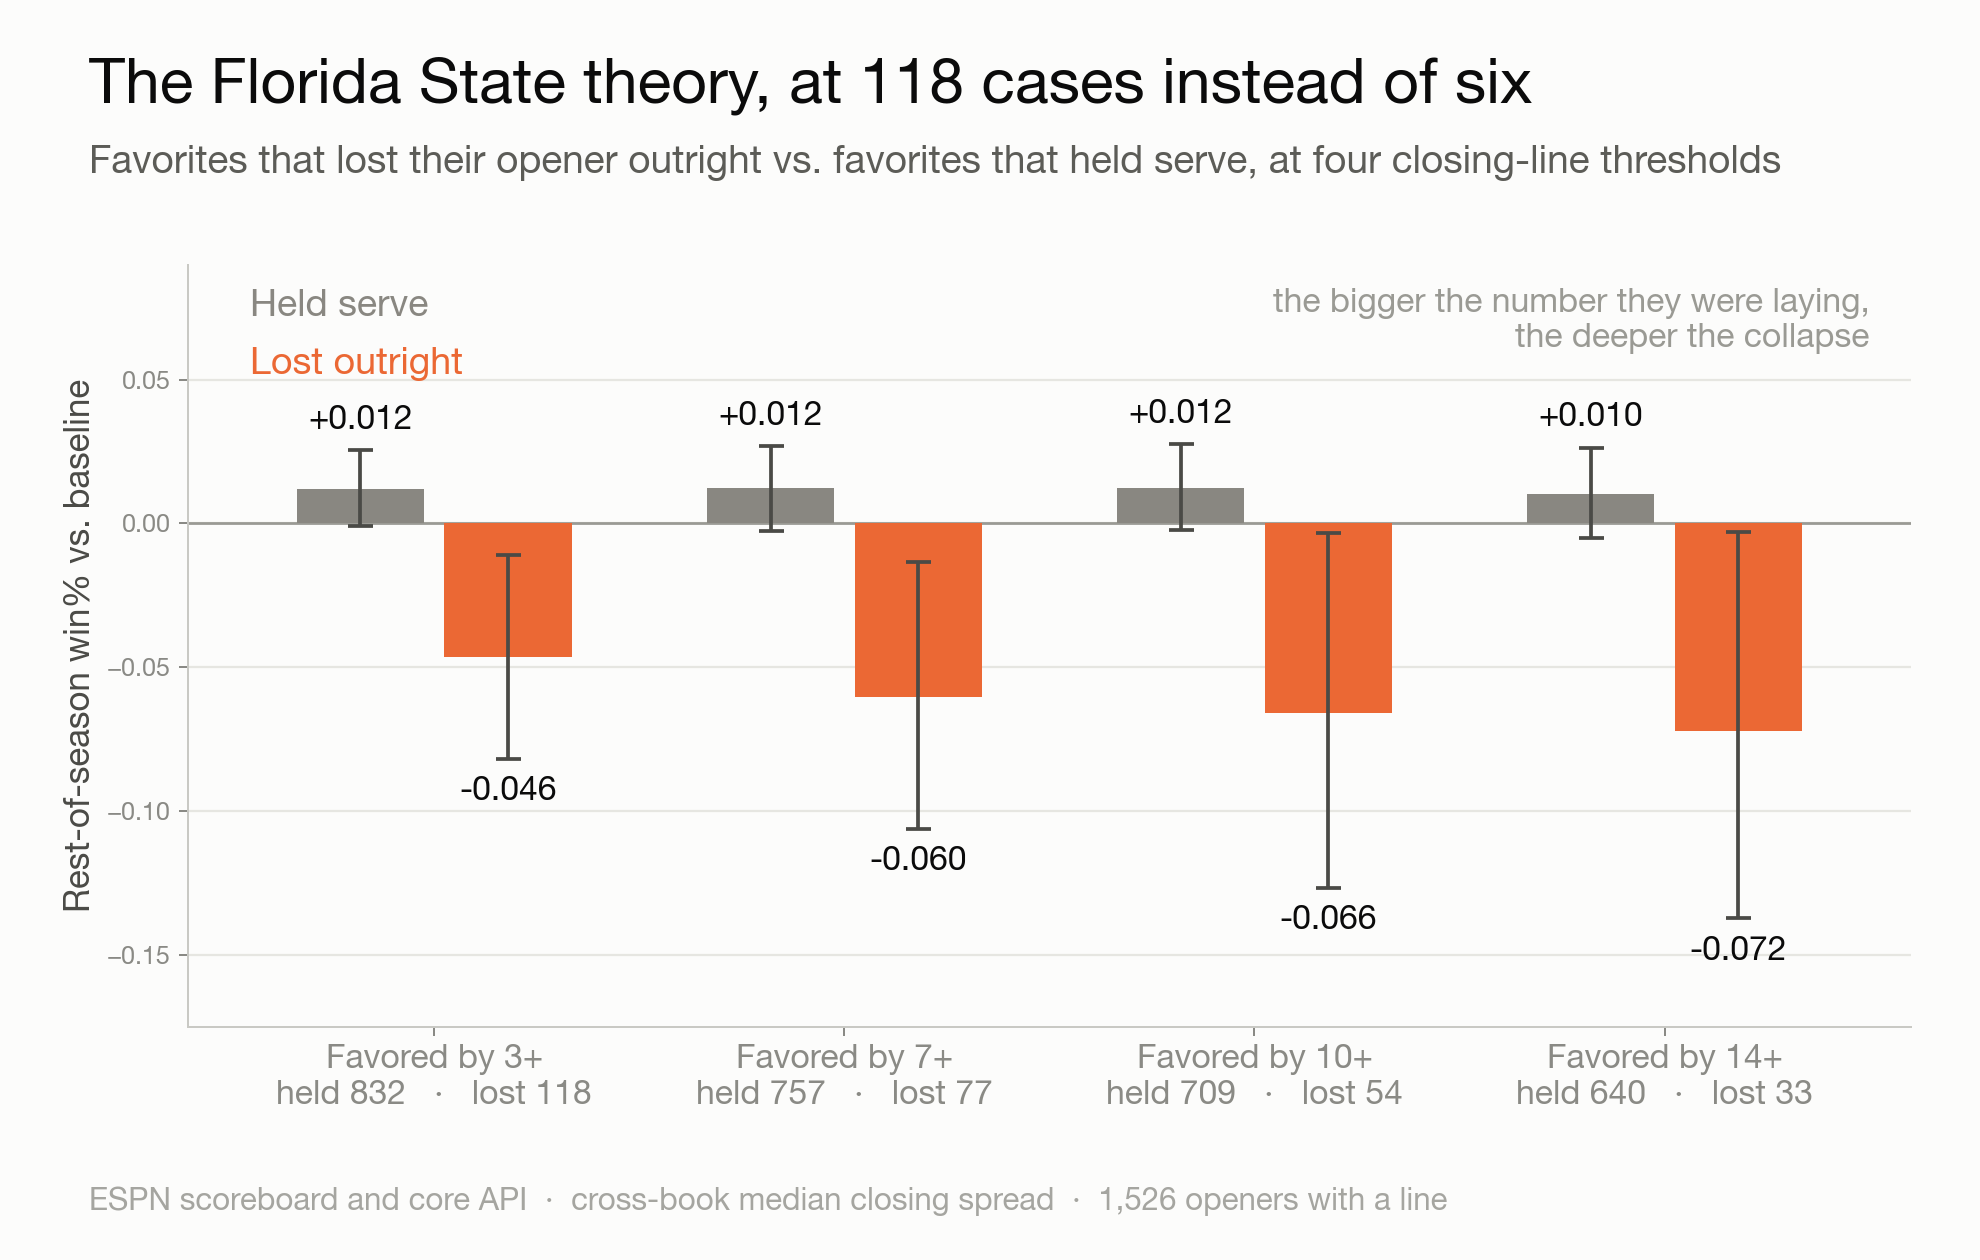
Now the question we started with. Teams that entered their opener as a favorite and lost outright:
| Favored by | Lost outright | Residual | Held serve | Residual | Gap (95% CI) |
|---|---|---|---|---|---|
| 3+ | 118 | -0.046 | 832 | +0.012 | -0.058 [-0.096, -0.020] |
| 7+ | 77 | -0.060 | 757 | +0.012 | -0.073 [-0.121, -0.023] |
| 10+ | 54 | -0.066 | 709 | +0.012 | -0.078 [-0.141, -0.017] |
| 14+ | 33 | -0.072 | 640 | +0.010 | -0.082 [-0.151, -0.014] |
Every gap clears zero, and the effect is monotonic: the bigger the favorite, the worse the collapse. A team favored by 14 or more that loses its opener underperforms its own baseline by 0.072, roughly eight tenths of a win, while teams that were favored and won come in slightly above baseline.
Note what this is not. It is not regression to the mean, because the comparison group is other favorites, who were equally good and who regress by essentially nothing. Losing a game you were supposed to win in Week 1 is genuinely different from winning it, in a way that persists for three months.
This is the six-game Week 0 pattern, tested properly. 118 games instead of 6, and it holds. Florida State was not a fluke of narrative. It was the loudest instance of something real.
The worst cases in the data are a good tour of the phenomenon:
- 2021 Indiana, coming off a 6-1 season, lost its opener to Iowa by 28. Finished 2-10.
- 2018 Louisville lost to Alabama by 37. Finished 2-10.
- 2013 Purdue lost to Cincinnati by 35. Finished 1-11.
- 2017 Tulsa, coming off 9-3, lost to Oklahoma State by 35. Finished 2-10.
Who you played matters as much as whether you won
Openers against FCS opposition behave differently, and the direction is a little uncomfortable for the sport:
| Opener vs FCS | n | Residual |
|---|---|---|
| Beat an FCS team | 470 | -0.032 |
| Lost to an FCS team | 37 | -0.083 |
Losing to an FCS team is about as bad a signal as exists, worth roughly -0.05 beyond simply having scheduled one. But note that beating one also sits below baseline. Teams that open against FCS opponents tend to underperform their prior record regardless of the result, which is a statement about the kind of program that schedules that game, not about the game itself.
The practical read: an FCS opener is close to informationless. If your team beat an FCS opponent by 40 last Saturday, you learned nothing, and the sample agrees.
A strange one: Week 0 itself may cost you
Since we had both datasets, we checked whether playing in Week 0 is associated with anything, independent of the result.
| Opened in | n | Prior | Rest of season | Residual |
|---|---|---|---|---|
| Week 0 | 75 | .478 | .445 | -0.049 [-0.095, -0.005] |
| Week 1 or later | 1,485 | .529 | .522 | +0.002 [-0.008, +0.013] |
Week 0 teams underperform their own baseline by about half a win, and the interval clears zero.
We are flagging this as interesting, not established. The obvious confounds are real: Week 0 exists largely because of travel exemptions, so the group is loaded with teams that flew to Dublin or Hawaii, plus Hawaii itself, which has played in Week 0 every season since 2016. Those teams have a compressed camp and a brutal first trip. With n=75 and an interval that only just clears zero, treat this as a question worth asking rather than an answer.
What to actually do with opening weekend
Ignore close games. A one-score opener, won or lost, carries no information. This is the most common thing people over-read and the data is unambiguous.
Take blowouts seriously, in both directions. A 21-point win over a real opponent is the strongest positive signal available in Week 1. A 21-point loss is nearly as strong the other way.
Take a favorite losing outright very seriously. This is the Florida State theory and it survives contact with 118 cases. The larger the closing line they were laying, the more it matters.
Discount FCS games entirely.
And keep the magnitude in mind. The largest effect in this entire study is about eight tenths of a win. Opening weekend moves the picture by a fraction of a game, while the conversation around it moves by three or four. That gap between what the result means and what people say it means is the most reliable thing about opening weekend.
Method
- Games: ESPN public scoreboard API, FBS (group 80), every day from August 15 to October 5, 2013 through 2025. An opener is each FBS team's first game of that season.
- A trap worth documenting: ESPN's scoreboard silently drops games when a date-range query's boundaries cut across its internal week buckets. Querying
20240815-20240824returns zero events despite Aug 24 having games, and20240825-20240903omits Aug 25. Our first pull used 10-day ranges and consequently recorded the second game of the season as the opener for every Week 0 team. Everything here is built from day-by-day queries, which are the only reliable form. - Records: ESPN core API, regular season only. Rest-of-season record removes the opener itself, so the outcome never contains the predictor.
- Baseline: rest-of-season win% regressed on prior-season win% (
ros = 0.253 + 0.504 * prior, n=1,560). The residual is the outcome variable throughout. - Lines: cross-book median closing spread, home-relative, live in-game lines excluded. Available for 1,526 of 1,560 openers.
- Sample: 2020 is excluded entirely. Teams played wildly different schedule lengths at wildly different times and the season is not comparable.
- Stats: OLS plus bootstrap confidence intervals (2,000 to 3,000 resamples). Intervals move in the third decimal with the random seed.
- Limits worth stating. Prior-season win rate is a crude prior. It does not know about coaching changes, portal turnover, or returning production, and it is a particularly poor baseline for a team like 2024 Florida State that went 13-0 the year before. A better model would use a preseason market number, ideally a win total, which would let us ask the sharper question of whether openers beat the market's prior rather than last year's record. We did not have historical win totals. That is the natural next version of this.
← Back to all posts