We graded 3,363 NBA playoff player props. The over hit 45% of them.
A prop line is meant to be a coin flip. Across the 2026 playoffs the over lost in every stat, most of it in blowouts, and no player beat the line by more than luck allows.
By Parker · October 8, 2026 · 8 min read
A typical preseason prop article gives you ten players and a reason for each. This one started as that article. Before writing it we wanted to know the thing every such article assumes: does a player who beats his line one year keep doing it?
That needs last season's prop lines next to last season's box scores. We had the box scores. We found the lines in an archive that only goes back to April 12, which means we have the 2026 playoffs and nothing before them. So the question we can answer is a smaller one, and it turned out to be more interesting.
The short version: the over lost. It hit 45.1% of the time, the shortfall shows up in every stat, and most of it comes from blowouts. And across 27 players with 10 or more points props, nobody beat the line by more than luck allows.
What we graded
Every player prop with a line from both Dabble and Underdog in the 36 hours before tip-off, where the two books were within a point of each other. The line we grade against is the average of the two, taken from the last update before the game started.
Then we graded each one against the actual box score. Players who did not play were dropped, and so were the 67 props that landed exactly on the line.
3,363 props across 58 of the 85 playoff games and 124 players, covering points, rebounds, assists, threes and the four combinations of the first three.
The over lost
| Stat | Props | Over | Under | Over % (95% interval) |
|---|---|---|---|---|
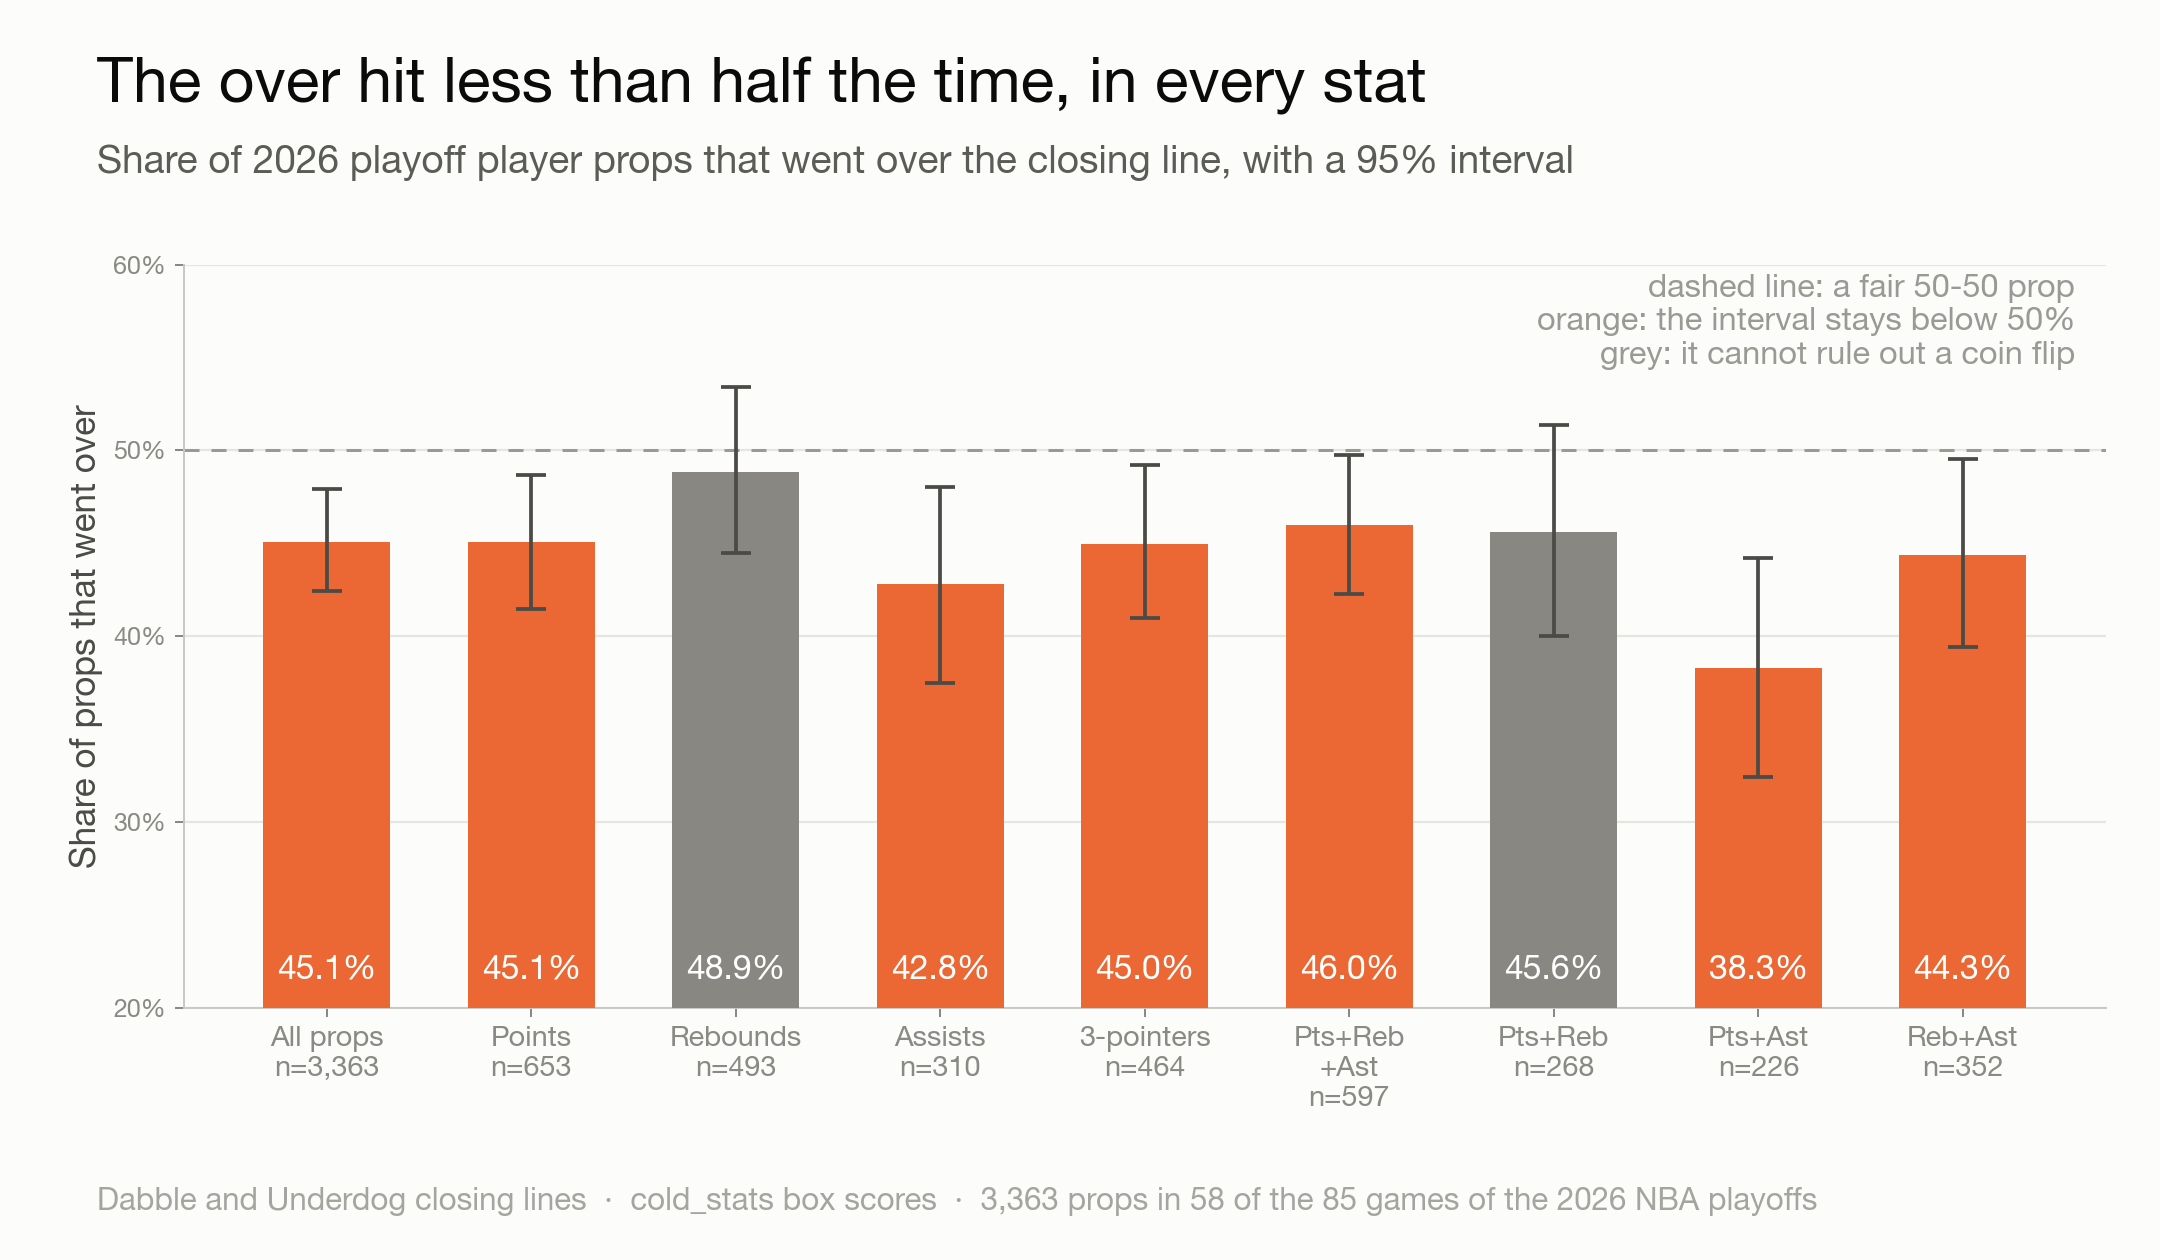
| All props | 3,363 | 1,486 | 1,810 | 45.1% [42.4, 47.9] |
| Points | 653 | 289 | 352 | 45.1% [41.5, 48.7] |
| Rebounds | 493 | 235 | 246 | 48.9% [44.5, 53.4] |
| Assists | 310 | 128 | 171 | 42.8% [37.5, 48.0] |
| Threes made | 464 | 206 | 252 | 45.0% [41.0, 49.2] |
| Points + rebounds + assists | 597 | 270 | 317 | 46.0% [42.3, 49.8] |
| Points + rebounds | 268 | 120 | 143 | 45.6% [40.0, 51.4] |
| Points + assists | 226 | 85 | 137 | 38.3% [32.4, 44.2] |
| Rebounds + assists | 352 | 153 | 192 | 44.3% [39.4, 49.5] |
Over and under counts leave out pushes. Intervals come from resampling whole games, because props from the same game share its pace and its blowouts.
The pooled number clears 50%: the over won 45.1% of decided props, and the interval tops out at 47.9%. Six of the eight stats clear it on their own and two cannot quite rule out a coin flip, but every one of the eight points the same way.
Look at the average miss, too. The typical points prop finished 0.15 points under its line, and rebounds and threes were within a tenth of a point. The lines are not far off the average result. A line near the average with only 45% overs probably means a few big games are holding that average up while most games fall short of it. We did not test the shape of the distribution, so that is a likely reason rather than a finding.
It is a blowout effect
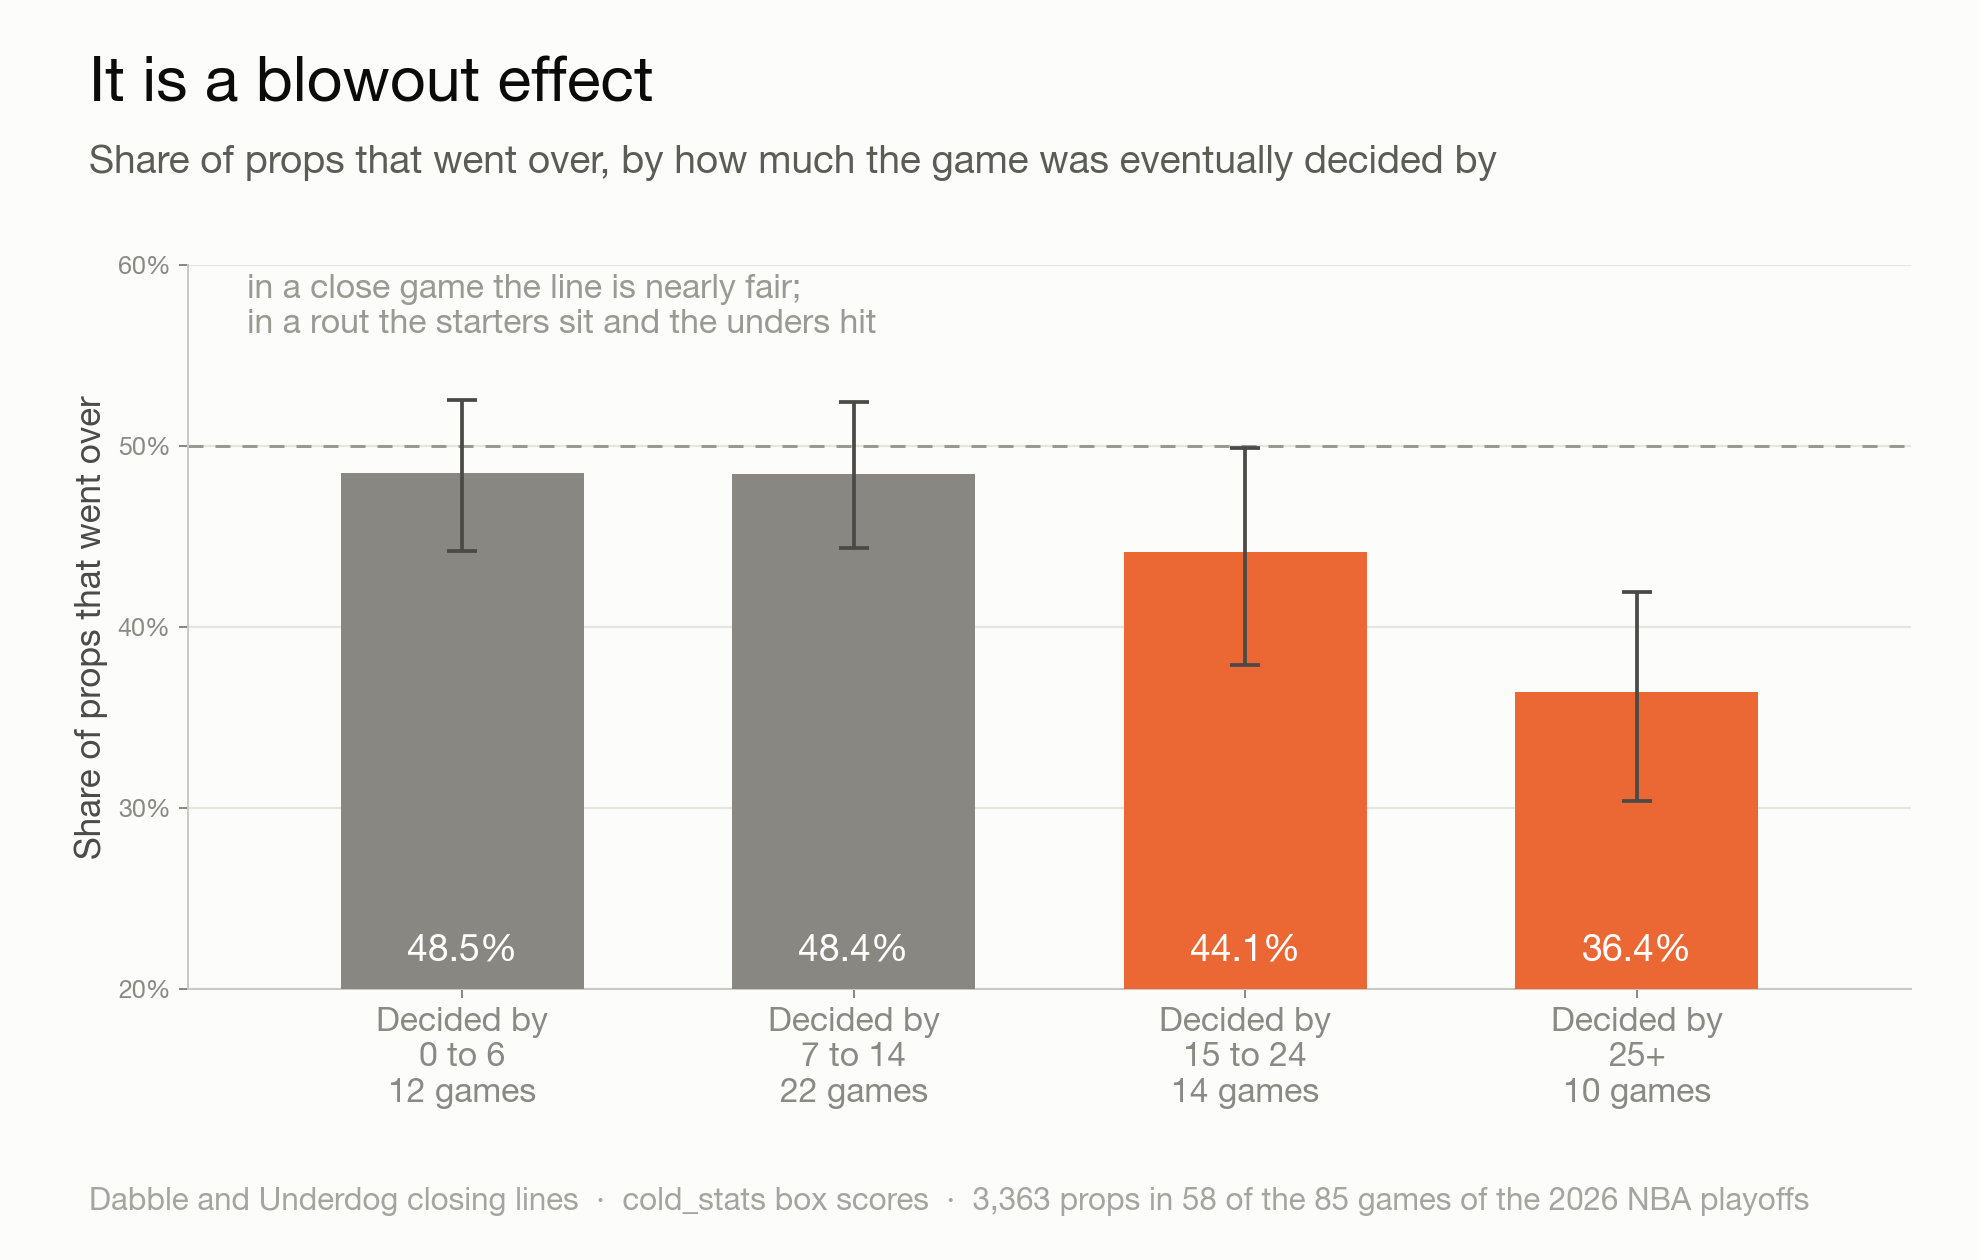
We went looking for where the unders came from, and one cut stood out. Bucket the props by how much the game was eventually decided by:
| Final margin | Games | Props | Over % (95% interval) |
|---|---|---|---|
| 0 to 6 | 12 | 687 | 48.5% [44.2, 52.5] |
| 7 to 14 | 22 | 1,209 | 48.4% [44.4, 52.4] |
| 15 to 24 | 14 | 811 | 44.1% [37.9, 49.9] |
| 25 or more | 10 | 656 | 36.4% [30.4, 41.9] |
In a game that stayed within 14 points, the over won about 48 times in 100. In the ten games decided by 25 or more, it won 36.
The mechanism is easy to see in the minutes. Starters in close games averaged 35.8 minutes. In the 25-plus games they averaged 29.1, and their overs hit 34.6% [29.7, 39.0]. A line is written for a competitive game. When the game stops being one, the starters sit, and the line no longer applies.
Two cautions. We looked at margin after seeing the overall lean, so treat it as an explanation rather than a test. And the margin is only known after the game, so this is not something you could have used beforehand. It tells you why the average is below 50%, not how to beat it.
Nobody beat the line
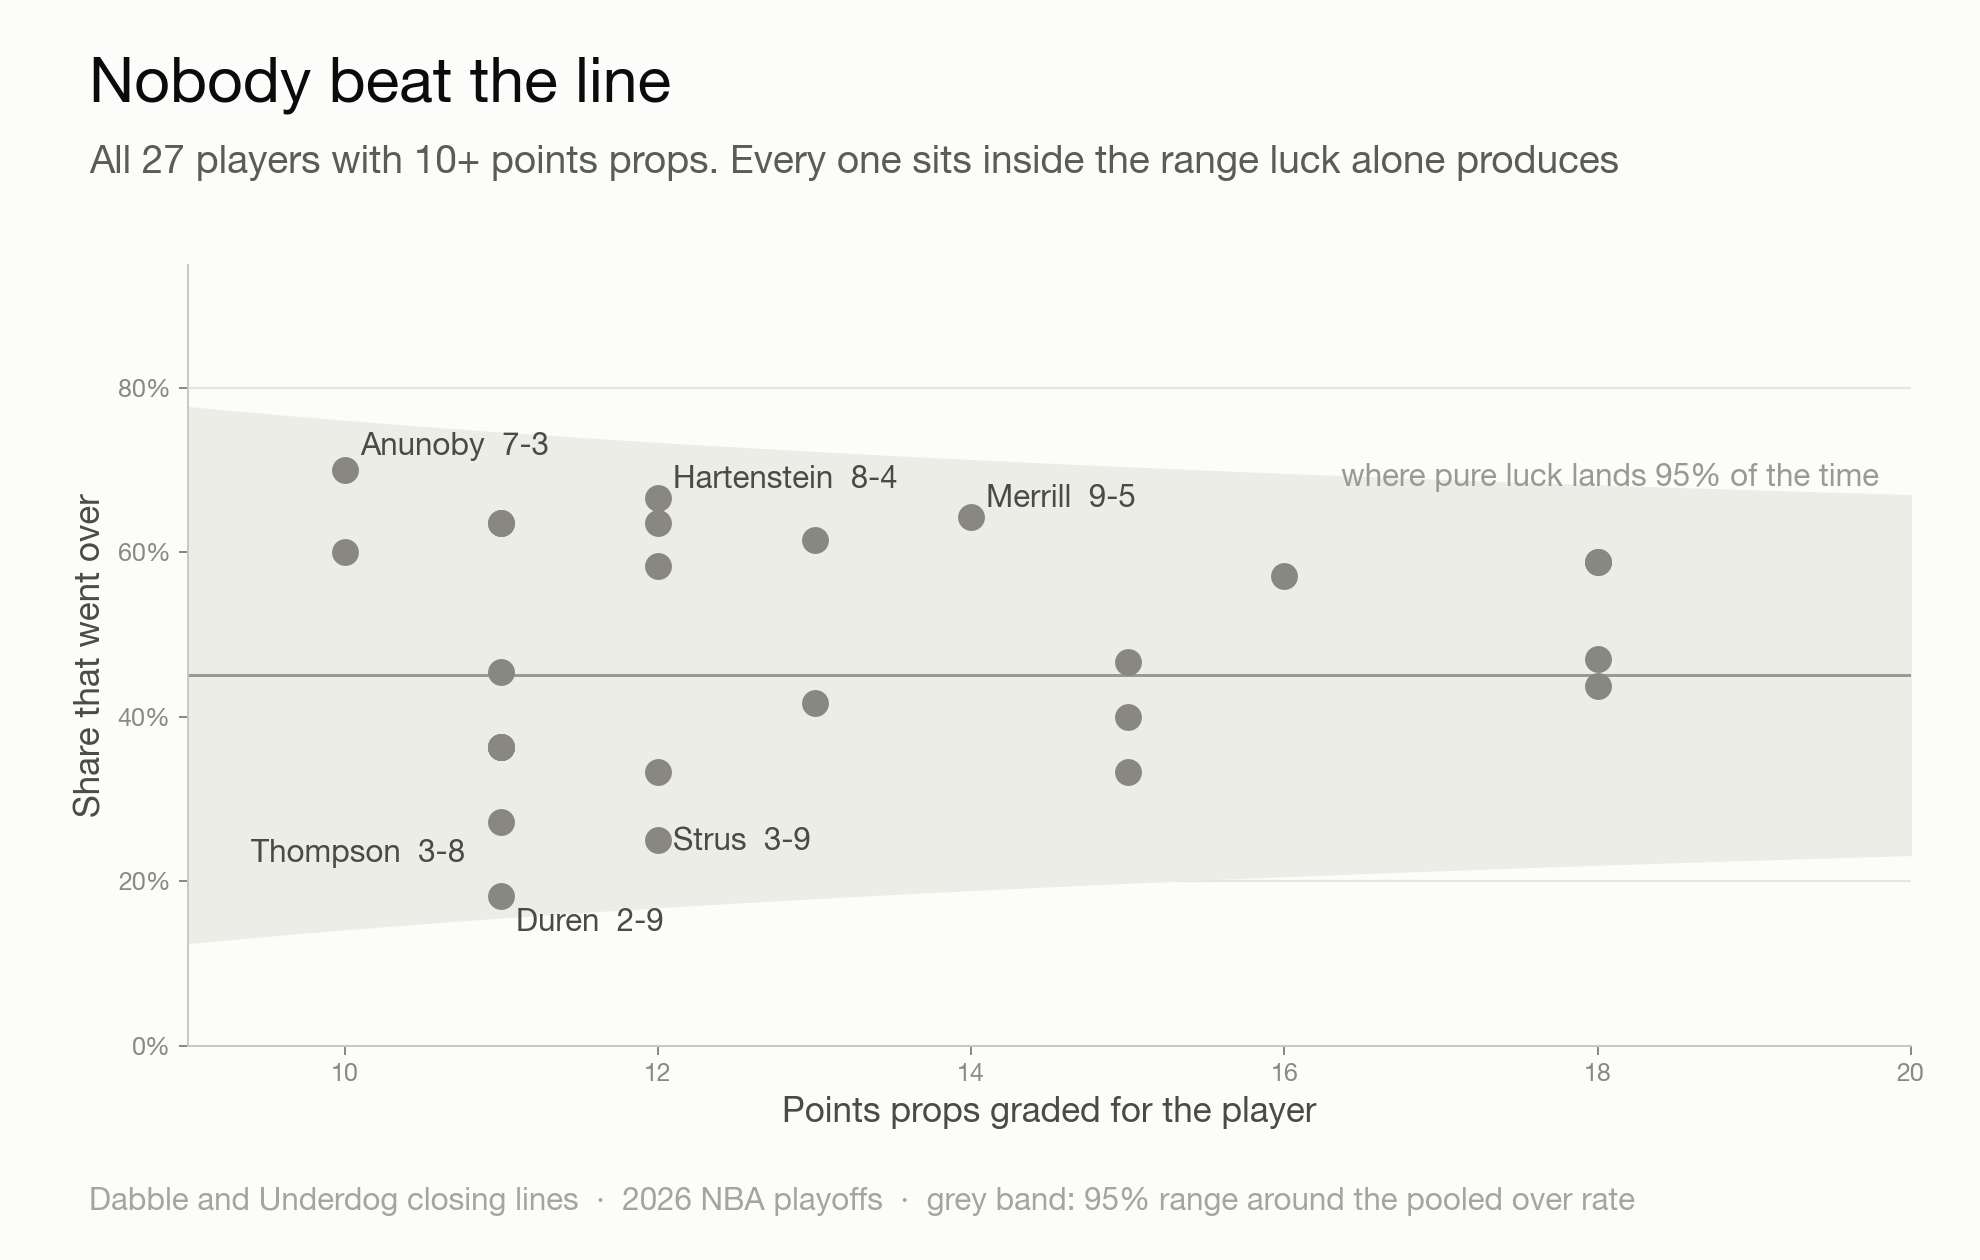
Now the question we started with. Take every player with at least 10 graded points props, 27 in all, and ask whether any of them stands out from the pack.
Pure luck predicts a spread. A player with 10 props will land anywhere from about 14% to 76% over just by chance, and that range narrows slowly as the sample grows. All 27 sit inside it. About 1.4 would be outside by chance alone, and we found none.
The extremes are fun to read, as long as you hold them loosely:
- Best: OG Anunoby 7-3, Isaiah Hartenstein 8-4, Sam Merrill 9-5.
- Worst: Jalen Duren 2-9, Max Strus 3-9, Ausar Thompson 3-8.
Those records are what a coin produces. With 10 to 18 games per player, a hot or cold run is indistinguishable from luck, and that is the honest reason a "players to watch" list built on one season of results should not be trusted. It would be a list of names with good-looking records and no way to tell skill from variance.
The market moves, and it makes no difference
One more thing the data can answer. When a player goes over his points line, does the next line rise, and does the next game follow it?
| Last game | Next games | Line moved | Next game went over |
|---|---|---|---|
| Over | 247 | +0.49 | 47.8% |
| Under | 274 | -0.47 | 46.0% |
The lines do chase the last result, by about half a point. The next game does not care: the over rate differs by 1.8 points, which is well inside noise. A hot game moves the number, and the number is no more or less likely to be beaten for it.
What this does not say
It is only the playoffs. The archive our lines come from starts on April 12. We have no regular-season lines, so we cannot tell you whether the regular season leans the same way, and playoff rotations tighten in ways the regular season does not.
It is two apps, not a sportsbook. Dabble and Underdog are pick'em apps, where you choose over or under on a line without a price on each side. A line that leans high is not the same as a mispriced bet, and 45% overs is not a betting system.
It is 58 of 85 games. The rest did not have a usable line from both apps.
It says nothing about 2026-27. A thin sample of playoff games cannot tell you who beats a line next season, and the persistence question we set out to answer still has no data behind it.
What to take from it
A prop is close to a coin flip only in a competitive game. In a rout the unders pile up. Whether the pregame spread flags the rout in advance is the obvious next test, and we have not run it.
Distrust a single player's record against the line. At 10 to 18 games the best and worst records are what chance produces. Anything under about 30 games is a story, not evidence.
Expect the line to follow the last game, and the next game not to follow the line. The half-point move after a hot night is real, and it does not buy you anything.
Whether a player repeats beating his line can be tested properly once there is a full regular season of lines to grade. That is the version worth running.
Method
- Results: every 2026 NBA playoff box score from our
cold_statsdatabase (85 games). Play-in and regular-season games are excluded. - Lines: raw line updates from our odds-history archive, April 12 to June 15, 2026. The archive stores a participant id where a player name should be, so names were recovered from the archived participant records. Only Dabble and Underdog are used: both post a single line per player and stat.
- A trap worth documenting: PrizePicks is not usable here. It stores its whole alt-line ladder, about 11 different lines per player per stat, under one label, so there is no way to pick out the base line. Our first pass graded against it anyway and reported the over winning 65% of points props, an artifact of grading against whichever rung of the ladder happened to update last. A star's average "line" came out at 12 points. What caught it was checking a known player: Jalen Brunson's average line was 12.2, and Dabble and Underdog both had him at 26.5.
- Closing line: for each book, the last line update within 36 hours before tip-off. A prop is kept only when both books have a line and they are within 1.0 of each other (average gap across the dataset: 0.23). The graded line is the average of the two.
- Grading: over means strictly above the line, under means strictly below, and a push is dropped. Players with zero minutes or a listed DNP are dropped. The combination props are the sums of the box-score columns.
- Intervals: the share of props that went over, resampled by game (4,000 resamples, seed 11), so props from one game stay together.
- Player band: for a player with n graded points props, the 95% range around the pooled over rate of 45.1% is the normal approximation,
p ± 1.96 * sqrt(p * (1 - p) / n). - Next game: points props only, comparing a player's consecutive graded games, with pushes dropped.
- Limits worth stating. The pooled props are not independent: points, rebounds and the combinations all describe the same player in the same game, which is why every interval above is resampled by game rather than by prop. We tested eight stats and four margin buckets, so a few of the individual intervals will clear 50% by luck, and only the pooled and the 25-plus results should carry weight. The margin cut was found after the overall result, not before it. And 10 of the 58 games were decided by 25 or more, so that bucket rests on ten games.
← Back to all posts